Appendix 1: NEW ORGANISATION
As of the start of the new financial year, the Group implemented a reorganisation and formed a fifth business area. The new Automation business area has been formed through the division of the Components business area.
The purpose of this organisational change is to achieve greater growth potential and efficiency among the companies, and this change enables them to benefit from each other’s networks and experience. The reorganisation of Components and Automation allows Addtech to benefit more effectively from continued development and create additional opportunities for value-creating acquisitions, strengthening Addtech’s market positions in selected market segments. The reorganisation also provides opportunities for professional development paths for more key personnel within Addtech.
In addition, an adjustment has been made in the Industrial Process business area, which has consolidated its operations into two business units from four.
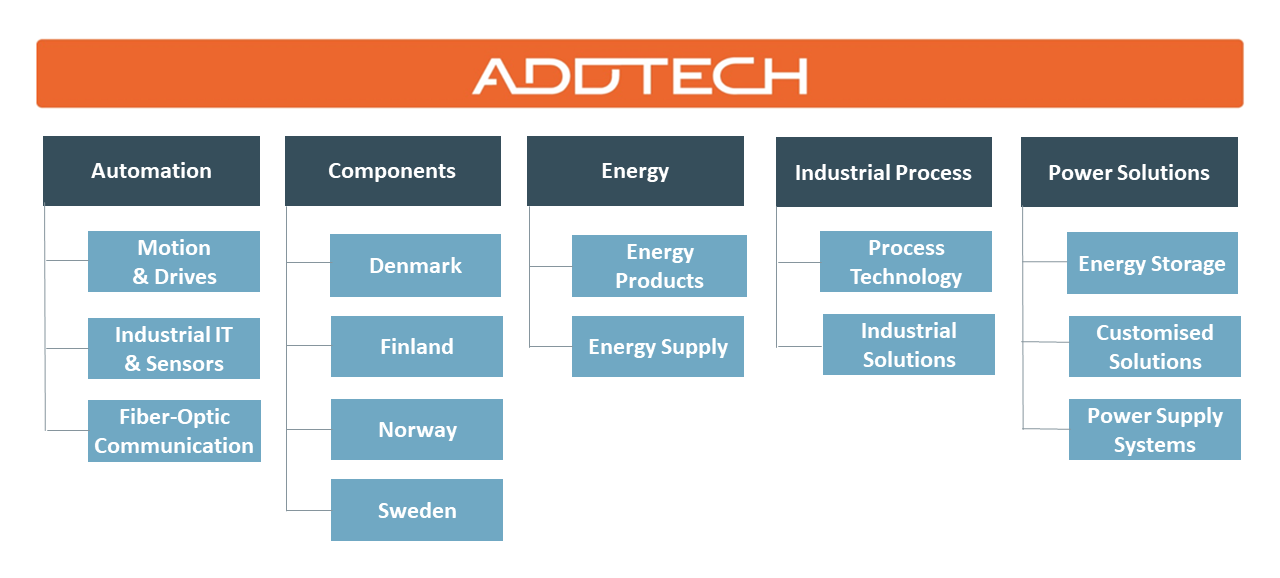
Automation
Automation markets and sells smart solutions, subsystems and components to segments such as industrial automation and infrastructure, including solutions for robotics, control systems, sensors, industrial networks and communication networks.
|
Dynamisk graf: Automation - Sales per customer segment
|
Dynamisk graf: Automation - Sales per geographic market
|
Components
Components markets and sells components and subsystems in mechanics, electromechanics, hydraulics and electronics. Its customers mainly operate in the Nordic manufacturing industry.
|
Dynamisk graf: Components - Sales per customer segment
|
Dynamisk graf: Components - Sales per geographic market
|
Energy
Energy markets and sells products for electrical transmission and distribution and products in electrical safety, electrical installation and connection technology (circuitry). Its customers mainly operate in the energy and electrical installation market via specifiers and electricity wholesalers.
|
Dynamisk graf: Energy - Sales per customer segment
|
Dynamisk graf: Energy - Sales per geographic market
|
Industrial Process
Industrial Process markets and sells solutions, subsystems and components (often under own brand) which help to optimise industrial processes and flows. Its customers mainly operate in the North European manufacturing and process industry.
|
Dynamisk graf: Industrial Process - Sales per customer segment
|
Dynamisk graf: Industrial Process - Sales per geographic market
|
Power Solutions
Power Solutions develops, markets and sells components and system solutions that ensure power supply, as well as operation and control of movements or energy flows. Customers mainly work with special vehicles, energy, electronics and telecoms. The business area has strong brands of its own and niche production.
|
Dynamisk graf: Power Solutions - Sales per customer segment
|
Dynamisk graf: Power Solutions - Sales per geographic market
|
PRO FORMA BUSINESS AREAS NEW ORGANISATION FROM 2019-04-01
| Net sales by business area | 2018/2019 | 2017/2018 | |||||||
|---|---|---|---|---|---|---|---|---|---|
| Quarterly data, SEKm | Q4 | Q3 | Q2 | Q1 | Q4 | Q3 | Q2 | Q1 | |
| Automation | 549 | 481 | 444 | 472 | 393 | 388 | 347 | 339 | |
| Components | 553 | 482 | 451 | 474 | 455 | 380 | 332 | 368 | |
| Energy | 644 | 607 | 571 | 535 | 467 | 442 | 471 | 466 | |
| Industrial Process | 707 | 603 | 497 | 498 | 445 | 426 | 402 | 404 | |
| Power Solutions | 414 | 384 | 380 | 419 | 365 | 398 | 343 | 404 | |
| Group items | -3 | -6 | -5 | -3 | -4 | -4 | -3 | -2 | |
| Addtech Group | 2,864 | 2,551 | 2,338 | 2,395 | 2,121 | 2,030 | 1,892 | 1,979 | |
| EBITA by business area | 2018/2019 | 2017/2018 | |||||||
| Quarterly data, SEKm | Q4 | Q3 | Q2 | Q1 | Q4 | Q3 | Q2 | Q1 | |
| Automation | 52 | 48 | 45 | 49 | 28 | 35 | 43 | 36 | |
| Components | 64 | 45 | 53 | 58 | 51 | 33 | 27 | 31 | |
| Energy | 70 | 54 | 64 | 56 | 56 | 44 | 60 | 55 | |
| Industrial Process | 71 | 48 | 50 | 50 | 38 | 32 | 39 | 33 | |
| Power Solutions | 54 | 56 | 56 | 57 | 50 | 50 | 47 | 51 | |
| Parent Company and Group items | -2 | -5 | 2 | -10 | -2 | -4 | -3 | 8 | |
| EBITA | 309 | 246 | 270 | 260 | 221 | 190 | 213 | 214 | |
| Depr. of intangible non-current assets | -49 | -43 | -44 | -39 | -37 | -35 | -32 | -33 | |
| – of which acquisitions | -47 | -42 | -42 | -38 | -36 | -34 | -31 | -32 | |
| Operating profit | 260 | 203 | 226 | 221 | 184 | 155 | 181 | 181 | |
| Net sales | 3 months | Rolling 12 months | |||||||
|---|---|---|---|---|---|---|---|---|---|
| SEKm | 31 Mar 2019 | 31 Mar 2018 | 31 Mar 2019 | 31 Mar 2018 | |||||
| Automation | 549 | 393 | 1,946 | 1,467 | |||||
| Components | 553 | 455 | 1,960 | 1,535 | |||||
| Energy | 644 | 467 | 2,357 | 1,846 | |||||
| Industrial Process | 707 | 445 | 2,305 | 1,677 | |||||
| Power Solutions | 414 | 365 | 1,597 | 1,510 | |||||
| Group items | -3 | -4 | -17 | -13 | |||||
| Addtech Group | 2,864 | 2,121 | 10,148 | 8,022 | |||||
| EBITA and EBITA margin | 3 months | Rolling 12 months | |||||||
| 31 Mar 2019 | 31 Mar 2018 | 31 Mar 2019 | 31 Mar 2018 | ||||||
| SEKm | % | SEKm | % | SEKm | % | SEKm | % | ||
| Automation | 52 | 9.4 | 28 | 7.0 | 194 | 10.0 | 142 | 9.7 | |
| Components | 64 | 11.5 | 51 | 11,3 | 220 | 11.2 | 142 | 9.3 | |
| Energy | 70 | 11.0 | 56 | 12.2 | 244 | 10.4 | 215 | 11.7 | |
| Industrial Process | 71 | 10.0 | 38 | 8.6 | 219 | 9.5 | 142 | 8.5 | |
| Power Solutions | 54 | 13.0 | 50 | 13.6 | 223 | 14.0 | 198 | 13.1 | |
| Group items | -2 | -2 | -15 | -1 | |||||
| EBITA | 309 | 10.8 | 221 | 10.4 | 1,085 | 10.7 | 838 | 10.5 | |
| Depr. of intangible non-current assets | -49 | -37 | -175 | -137 | |||||
| – of which acquisitions | -47 | -36 | -169 | -133 | |||||
| Operating profit | 260 | 9.1 | 184 | 8.7 | 910 | 9.0 | 701 | 8.7 | |
Reconciliation tables alternative performance measures
| EBITA and EBITDA | 12 months ending | |||
|---|---|---|---|---|
| Addtech Group, SEKm | 31 Mar 2019 | 31 Mar 2018 | 31 Mar 2017 | 31 Mar 2016 |
| Operating profit (EBIT) | 910 | 701 | 604 | 443 |
| Amortization, intangible assets (+) | 175 | 137 | 111 | 93 |
| EBITA | 1,085 | 838 | 715 | 536 |
| Depreciation, tangible assets (+) | 52 | 43 | 40 | 34 |
| EBITDA | 1,137 | 881 | 755 | 570 |
| Working capital and return on working capital (P/WC) | 12 months ending | |||
|---|---|---|---|---|
| Addtech Group, SEKm | 31 Mar 2019 | 31 Mar 2018 | 31 Mar 2017 | 31 Mar 2016 |
| EBITA (12 months rolling) | 1,085 | 838 | 715 | 536 |
| Inventory, yearly average (+) | 1,304 | 1,037 | 941 | 846 |
| Accounts receivables, yearly average (+) | 1,542 | 1,231 | 1,043 | 894 |
| Accounts payables, yearly average (-) | 817 | 677 | 622 | 532 |
| Working capital (average) | 2,029 | 1,591 | 1,362 | 1,208 |
| Return on working capital (R/RK) (%) | 53% | 53% | 53% | 44% |
| Acquired- and organic growth | 3 months | 12 months | |||
|---|---|---|---|---|---|
| Addtech Group | 31 Mar 2019 | 31 Mar 2018 | 31 Mar 2019 | 31 Mar 2018 | |
| Acquired growth (SEKm, %) | 236 (11%) | 173 (9%) | 999 (12%) | 557 (8%) | |
| Organic growth (SEKm, %) | 459 (22%) | 22 (1%) | 903 (11%) | 356 (5%) | |
| Divestments (SEKm, %) | -17 (-1%) | -40 (-2%) | -65 (-1%) | -115 (-2) | |
| Exchange rate effect (MSEK, %) | 65 (3%) | 25 (1%) | 289 (4%) | 46 (1%) | |
| Total growth (SEKm, %) | 743 (35%) | 180 (9%) | 2,126 (26%) | 844 (12%) | |
| Net debt excl. pensions and net debt, excl pensions/equity ratio | 12 months ending | |||
|---|---|---|---|---|
| Addtech Group, SEKm | 31 Mar 2019 | 31 Mar 2018 | 31 Mar 2017 | 31 Mar 2016 |
| Financial net debt | 1,960 | 1,405 | 1,011 | 822 |
| Pensions (-) | -260 | -229 | -210 | -199 |
| Net debt excluding pensions | 1,700 | 1,176 | 801 | 623 |
| Equity | 2,520 | 2,131 | 1,741 | 1,514 |
| Debt to Equity ratio (excluding pensions) | 0.7 | 0.6 | 0.5 | 0.4 |
| Interest coverage ratio | 12 months ending | |||
|---|---|---|---|---|
| Addtech Group, SEKm | 31 Mar 2019 | 31 Mar 2018 | 31 Mar 2017 | 31 Mar 2016 |
| Profit after financial items | 865 | 665 | 580 | 423 |
| Interest expenses and bank charges (+) | 41 | 31 | 25 | 22 |
| Total | 906 | 696 | 605 | 445 |
| Interest coverage ratio | 22.1 | 22.7 | 23.9 | 20.3 |
| Capital employed and return on capital employed | 12 months ending | |||
|---|---|---|---|---|
| Addtech Group, SEKm | 31 Mar 2019 | 31 Mar 2018 | 31 Mar 2017 | 31 Mar 2016 |
| Profit after financial items | 865 | 665 | 580 | 423 |
| Financial expenses (+) | 62 | 71 | 39 | 30 |
| Profit after financial items plus financial expenses | 927 | 736 | 619 | 453 |
| Total assets, yearly average (+) | 6,324 | 4,996 | 4,143 | 4,286 |
| Non-interest-bearing liabilities, yearly average (-) | -1,604 | -1,319 | -1,167 | -1,172 |
| Non-interest-bearing provisions, yearly average (-) | -378 | -335 | -268 | -252 |
| Capital employed | 4,342 | 3,342 | 2,708 | 2,862 |
| Return on capital employed, % | 21% | 22% | 23% | 16% |